
8. Basics of Raster Data & Using Raster Data for Site Selection
These modules provided valuable training to help ensure the proper use of vector and spatial information. While creating new surfaces is a valuable process, the user must ensure that field data are properly collected and appropriately used during the process. Additionally, field data, as well as other considerations, such as environmental and socioeconomic impact, are often important considerations when developing a logical series of site selection procedures.
1. Basics of Raster Data
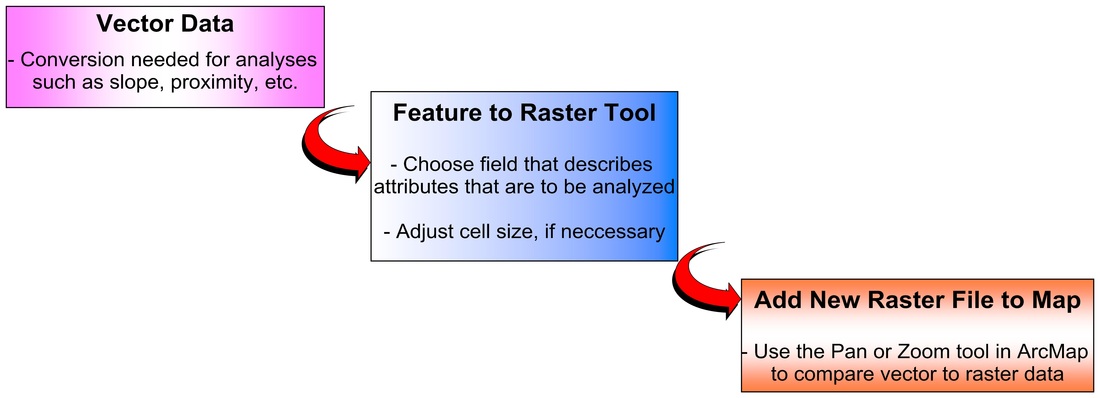
Problem: Conversion techniques of vector data to raster data.
Analysis Procedures: Raster data is a field based data model that represents geography as a continuum though using grid cells that store attribute values, but can also be used as discrete thematic rasters (i.e. temperature, elevation, land-use, soil type). The smaller the cell size, the greater the resolution and file size of the raster. Vector data models represent discrete points, line and polygons that are not continuous in nature. Vector models serve as the other primary dataset used in ArcGIS. These data models complement each other but can be converted if necessary using various conversion tools. Raster data tends to typically provide greater details, has a larger data volume and allows for more advanced analyses than vector data. Rasters can also be digital or scanned documents that can be used as attributes of a feature collected from a variety of sources such as aerial photography, satellite sensors, scanning maps, surveying, and from converting vector to raster data. Raster data can be stored in various formats including DEM's (Digital Elevation Models), USGS, ESRI Grids, and image formats including JPEG, TIFF, IMG and GIF.
Raster data is composed of cells in a grid like structure. Spatial resolution refers to the cell size and determines the level of detail that will be included within the raster display. The spatial resolution required depends on the type and scale of analysis, accuracy of the study and limitations such as time and data size. Scale refers to the level of detail displayed. The smaller the scale the less detail. An example of this is a display scale of 1:10,000 has less detail than a display scale of 1:5000. If the display scale of two images is the same/similar, but the cell size differs, the image with the smaller cell size will display greater detail and appear to provide a more thorough conclusion. A raster dataset may be composed of one or more bands. For example, a DEM has 1 band, whereas a aerial photo in color may have 3 bands. Each band represents a different color. Raster data can be found in various image formats (TIFF, JPEG, IMG, GRID, etc.) However, JPEG and TIFF are the most widely supported, used for a variety of data types and work well with color, black and white and gray scale images.
Results:

|

|
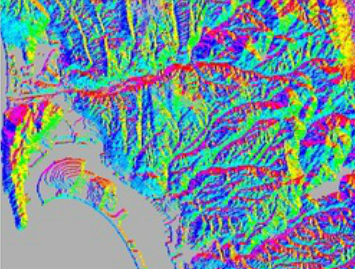
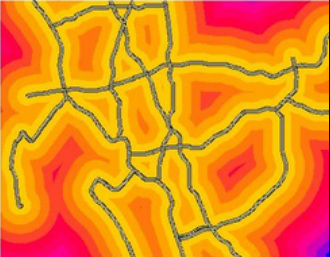
Left Image: Zoomed in screenshot of map showing road vector data (red and black lines) that have been converted to raster data (yellow, orange, brown). Some data may be lost or misinterpreted during data conversion and converted data may not be 100% accurate given this process. In this image, some of the detail of the roads vector data is lost upon the conversion to raster. Right Image: Conversion of vector (polyline) information into raster format produces roadways consisting of connecting raster cells. Additionally, the roadway width is not dependent on the assigned raster cell size.
2. Using Raster Data for Site Selection
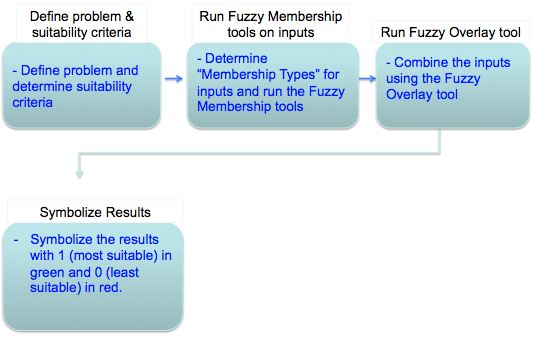
Problem: Using raster data and fuzzy logic, perform a suitability analysis for site selection.
Analysis Procedures: Using GIS and analysis tool determining the most suitable area for a purpose or particular analysis is referred to as site selection or suitability analysis. This can be performed using both vector and raster data. The benefit of using raster is the ability to use weighted or fuzzy logic tools in addition to the analysis that is possible with vector data. Binary site selection results in a clear yes/no conclusion for site suitability. Weighted site selection allows one to assign and/or rank relative importance to each data layer resulting in a range of least to most suitable sites and areas. This should not be used when the location cannot be controlled (i.e. wildlife areas, plants, etc.). Fuzzy logic assigns membership values (out of 1) that indicate the possibility and probability that a site will be suitable. Prior to performing a weighted analysis site selection, all of the raster data must be reclassified in order for suitability to be accurately measured on a uniform scale (i.e. 1-5, 1-9, 1-10, etc.). Fuzzy logic is ideal when prediction does not contain discrete boundaries, allowing the model to include inaccuracy in the dataset. Before using fuzzy logic, during the reclassification phase, the data is selected based on fuzzy membership type/class that best fits the data. The surfaces can be then overlaid by selecting an appropriate overlay type that will combine two or more of the raster membership data. After each layer has been reclassified, a weight (percentage) is assigned to each data layer to reflect it's ranking and importance to the analysis results. . This tool is ideal for analysis of animal and/or plant habitats.
Results:
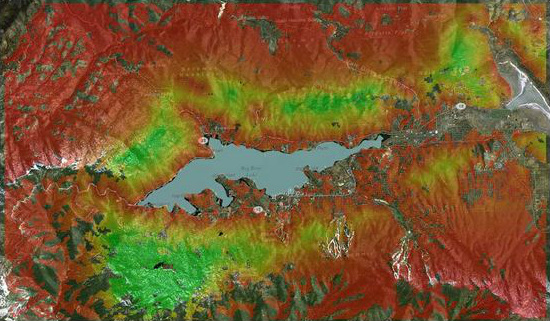
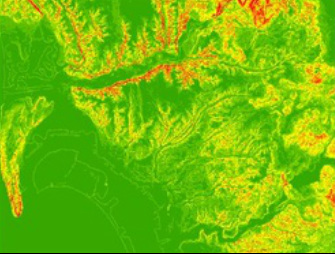
Figure 1. This image displays the results of using fuzzy logic for site selection when determining possible bald eagle nesting habitats. Red indicates areas where bald eagle nesting is not likely, green indicates highly likely, and yellow indicates intermediate possibility for nesting. This display contains a topographic hill shade raster developed from vector data. Each point represents a topographic elevation which was using for raster interpolation via Inverse Distance Weighting.
Wine quality begins in the vineyard, and proper site selection is an important goal of viticulturists. Wine flavors are directly influenced by factors related to where the grapevines grow, especially soil, climate, elevation, slope, and slope aspect. High-quality grapes can be produced in vineyards situated on less-than-ideal locations, but much labor can be saved by choosing a site with favorable conditions. No site is going to provide the perfect combination of elements, but the fewer compromises made, the better.
|
|
Left Image: Aspect image, the blue and light blue cells are South and Southwest facing and will be best for growing grapes. Right Image: The green and yellow areas of the slope raster represent gentle terrain, while the orange and red areas represent steeper areas. This surface will be used for reclassification in steps to follow.
|
|
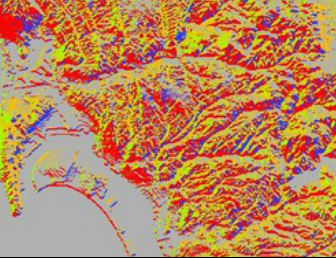
Left Image: The cells in orange are closer to freeways and are considered more suitable for a vineyard than areas in red and blue, which are farther away. This surface will be used in the steps to follow to determine the best sites for a vineyard. Right Image: This map displays a manually reclassified surface containing a 1 to 5 scale of suitability. The red areas are of suitable aspect measurements for a vineyard.
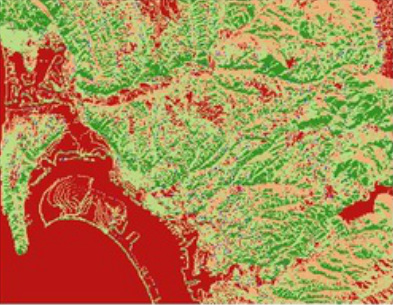
Figure 2. The most suitable areas for vineyard are in green. These areas were determined using the weighted overlay tool.

Application & Reflection: Raster data allows for the display of continuous data and makes advanced spatial analyses possible. Raster data has many applications and functions within crime analysis such as modeling areas, planning surveys, determining suitability for specific crimes based on criminal trends, etc. Furthermore, site selection using raster data is a powerful and very useful tool in crime analysis. The type of analysis can be used to determine areas that may be valuable and more susceptible to particular crimes based on trend analysis and preventative law enforcement measures. Determining this will protect communities and/or identify areas that could be improved with various tactical strategies and security measures.
