7. Spatial Statistics
Problem: Using various spatial statistical methods, determine if any emergency calls for Battalion 2 of the Fort Worth, TX Fire Department exhibit clustering and assess the level of clustering. Spatial statistics tools that increase the level of confidence that the distribution of features is not occurring due to random chance will be used.
Analysis Procedures: To complete the objective, it is essential to understand the spatial analysis tools that are used to study patterns and determine what the probability that the distribution of features is occurring due to random chance. A variety of tools will be used in ArcMap to illustrate spatial statistics analysis using four (4) specific models. First, one should identify where the Fort Worth Fire Department, Battalion 2 receives false alarms for February 2007. The visual display will assist in establishing target areas for safety campaigns explaining how to recognize emergencies and how to avoid false alarms. After visually evaluating one's data, spatial statistics can be used to identify and quantify spatial patterns and relationships, such as clustering within the data. While spatial statistical methods account for spatial characteristics, they may also use hypothesis testing similar to traditional statistical methods.
The four tools explained below evaluated whether the location of point features can be explained by a random chance.
- The Average Nearest Neighbor Tool will be used to determine if clustering exists based on distance to nearest neighbor. The average nearest neighbor tool calculates an index based on how close features are located and compares that distance to an index for randomly distributed features. This assesses clustering based on location alone. The tool is used by inputting the feature class of interest and setting the area to a size similar to the dataset. A nearest neighbor ratio, z-score and p-value are outputs.
- Next, I will identify areas where the Fort Worth Fire Department, Battalion 2 received services calls in January 2007 to determine if clustering occurred. The map will used Getis-Ord General G to calculate z-score if high or low values cluster by conducting analysis for various distances to determine maximum z-score. The Getis-Ord General G tool examines clustering based on value. The tool determine whether areas of similar values are more clustered than would be expected in a random distribution. To use this tool, the dataset must be examined for the approximate number of neighbors and the distance band. This assists in determining the distance range to use. The feature class and field of interest are inputs and the tool results in a G index, z-score and p-value.
- Then, areas where the Fort Worth Fire Department received service calls for January 2007 are identified to determine if clustering occurred when all neighbors were accounted for. The map uses a multi-distance clutering tool known as Ripley's K Function to run a large number of scenarios to provide a basis for comparing the levels of clustering and determining the most significant areas. The Ripley's K Function is similar to the nearest neighbor calculation, but can also examine multiple distances and factors other than the next nearest feature. This tool requires the layer of interest, number of distance bands and the number of confidence envelopes that should be used. The confidence envelope is a variation of the random distribution used for comparison.
- Lastly, the density of calls per block is identified to determine what distance densities cluster. The map will use the spatial autocorrelation tool known as Moran's I Function to identify if clustering is occurring in a clustered, random or dispersed manner using distances from 250-600 feet in increments of 50 feet. Moran's I combines evaluation of clustering by location and value. This tool requires a layer and field of interest, but also requires that a grid cell size be used. The grid cells should be large enough that all have at least one data point, but are small enough to display a range of values. The tool results in a z-score and p-value.

Figure 1. Spatial statistics workflow diagram for techniques used to evaluate clustering. Click on diagram for an enlarged image.
Results:

Figure 2. Results of using the nearest neighbor methods to calculate an index and z-score to determine clustering. Click on map for enlarged image.
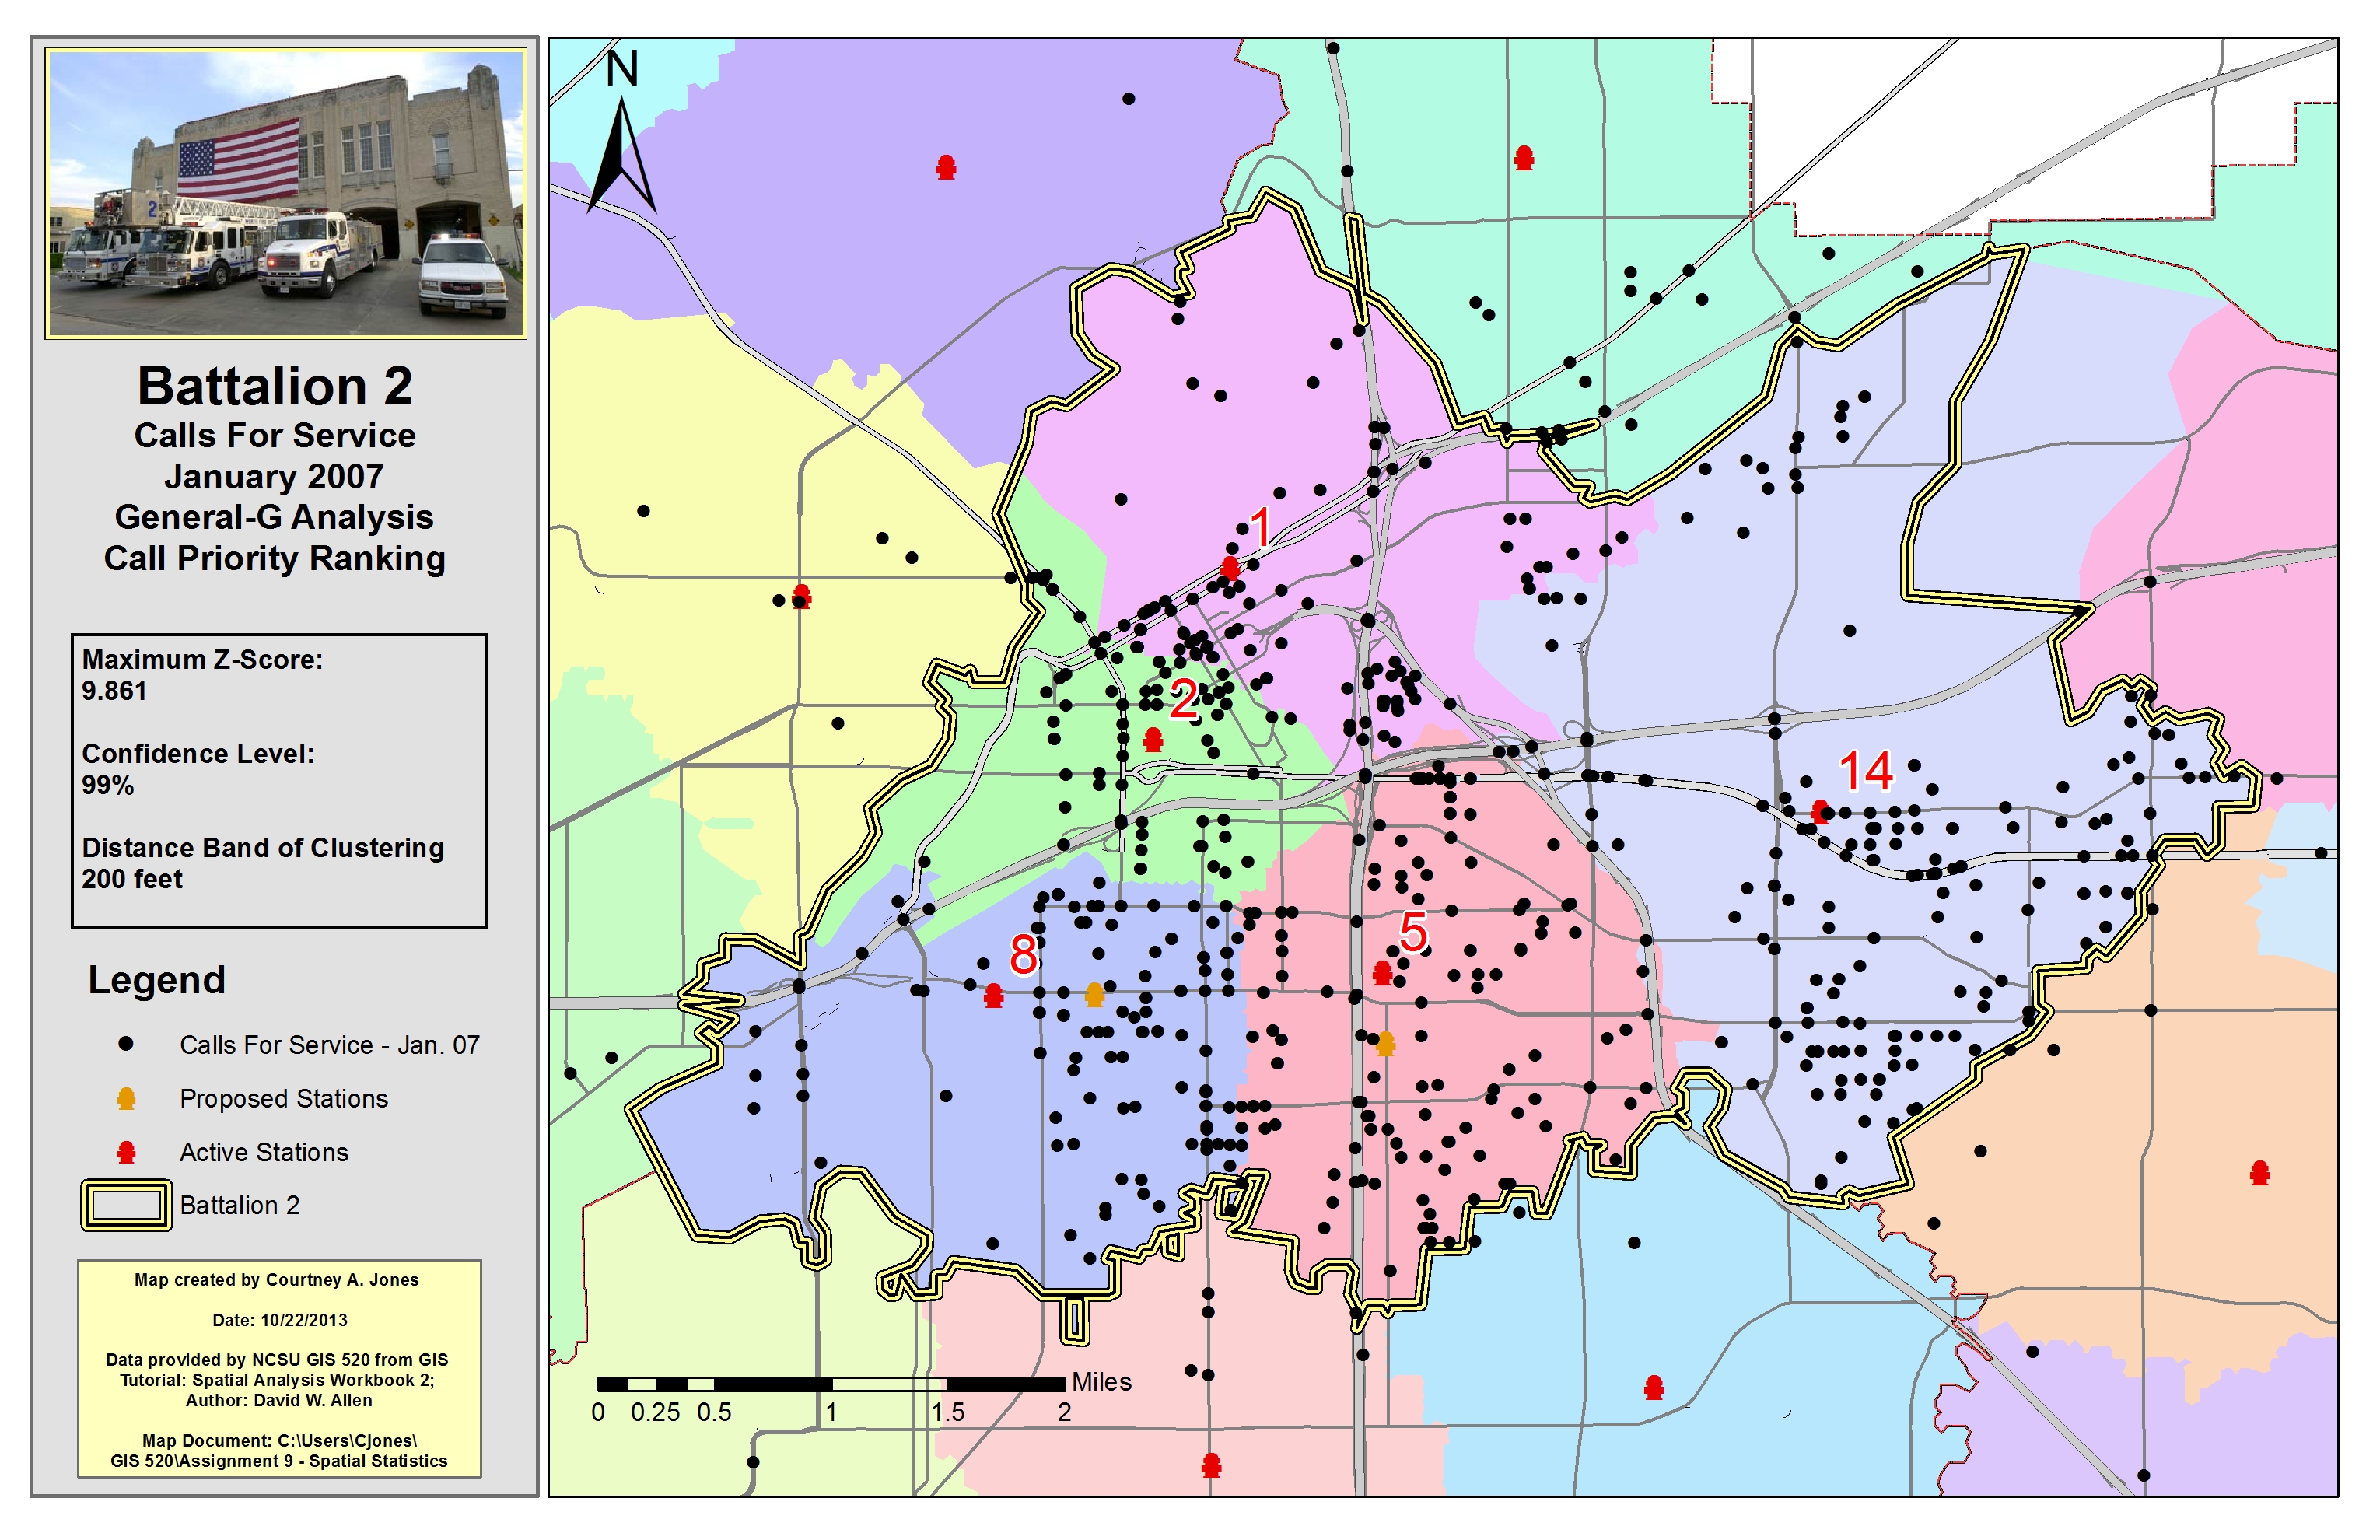
Figure 3. Results of using the Getis-Ord General G tool to calculate a z-score to assess whether the features were clustered. Click on map for enlarged image.

Figure 4. Results of using the multi-distance spatial cluster analysis tool, Ripley's K Function, to assess the significance of clustering. Click on map for enlarged image.

Figure 5. Results of using the spatial auto correlation tool, Global Moran's I, to determine z-scores and confidence levels assessing the level of clustering at varying distances. Click on map for enlarged image.
Application & Reflection:
Similar to the circumstances used within this exercise, spatial statistics could be used to assist the N.C. State Bureau of Investigation as well as Wake County EMS and the N.C. State Highway Patrol in joint efforts to prevent areas within N.C. that experience clusters of false 911 calls and reports. This will allow our employees to better serve their communities and the general public and give them an opportunity to prioritize their emergency calls according to life threatening situations. It will allow them to filter through the clustering areas and not spend as much time on false alarms and carelessdisputes. Personally, within the Criminal Intelligence Unit we run a “Special Operations” call center in which a criminal intelligence analyst serves as an on-call contact 24/7 every third week in a repetitive cycle. During this time, analysts often deal with false alarms, reports and calls.
On a tool-by-tool basis:
Since Average Nearest Neighbor identifies if physical locations are closer together than they would be expected within a random distribution, the tool could be utilized for determining incidents of specific crimes near areas of interests and determining if a correlation between random crimes and geographic areas occurs.
Since Getis-Ord General G (high/low clustering) tool can be applied to determine clustering, areas of gang activity and congregation can be analyzed near specific demographic areas to determine demographic impact on specific gang recruitment.
Since Ripley’s K function (Multi-Distance Spatial Cluster Analysis) calculates cluster based on all locations, this tool could be used by ISAAC (North Carolina’s Fusion Center) to identify locations/concentrations of law enforcement agencies within N.C. to assist in conference and training opportunities; possibly boosting participation and partnerships.
Since Spatial Auto Correlation and Moran’s I calculates cluster based on both location and value, this tool could be used to identify the ideal areas within N.C. suitable for growing mass quantities of marijuana. Since both density of THC (potency of marijuana) and geographic features of land are important, clusters of land with better geographic attributes along with areas where criminals have more experience producing higher THC products would indicate areas that are best suitable for mass marijuana grows (i.e. the Western part of N.C.).
